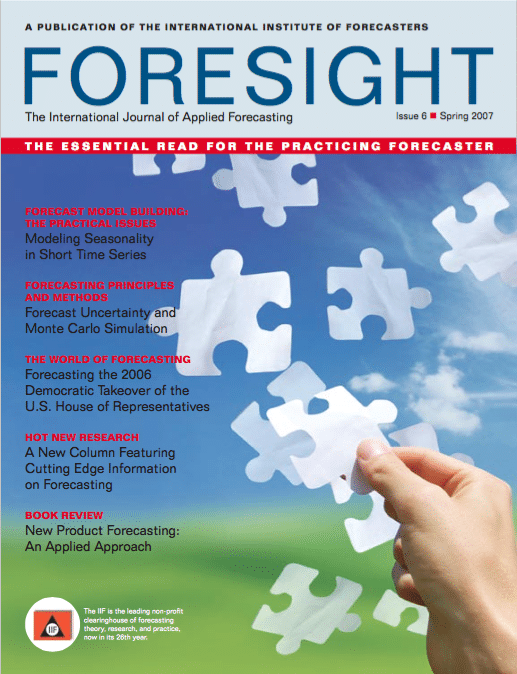
FORESIGHT, Issue 6
$45.00
Description
Spring 2007 Issue
Special Feature: Modeling Seasonality In Short Time Series
- Minimum Sample Size Requirements For Seasonal Forecasting Models by Rob Hyndman and Andrey Kostenko
Rob and Andrey lead off the section by discussing the bare minimum data requirements for fitting three common types of seasonal models: regression with seasonal dummies, exponential smoothing, and ARIMA. With fewer than the minimum number
of data points, seasonal index estimates would have infinite margins for error. - Forecasting Short Seasonal Time Series Using Aggregate and Analogous Series by Michael Leonard
Michael Leonard writes that for seasonal time series with relatively short histories, you’d be wise to seek additional sources of information outside the historical data on the items themselves. Two potentially promising sources of external information are the histories of analogous products and of the product aggregate in which the item is a component. The idea is that the seasonal patterns contained in analogous and/or aggregate series can be modeled and transferred to the original series. Michael presents a selection tree to help the analyst choose an appropriate modeling approach. - Seasonality: Shrinkage Procedures For Small Samples by Dan Williams
Dan Williams illustrates the major statistical problems with seasonal indexes obtained from short time series. First, it is difficult to distinguish the true seasonal index from the year to- year random variation in the index. Second, the measured seasonal indexes are particularly sensitive to anomalies in the data. Third, there is evidence that, with short series, the measurements exaggerate the variation across seasons. - Constant vs. Changing Seasonality by Philip Hans Franses
Philip Hans Franses introduces an additional complexity, the problem of allowing seasonal patterns to change over time. He notes that most of the standard models presume a constant seasonal pattern; that is, a given month or quarter has an index value assumed to be the same every year. His preference is to use models that allow the seasonal pattern to evolve over time, models with names such as periodic models and time dependent parameter models. He notes, however, such models can substantially increase sample size requirements.
Articles
-
- Confessions Of A Pragmatic Forecaster by Chris Chatfield
Chris Chatfield draws on his experience of over 40 years of forecasting to make some practical recommendations about the choice and implementation of forecasting methods, and to offer advice to forecasting practitioners and consultants. - Forecast Uncertainty And Monte Carlo Simulation By Sam Sugiyama
Sam Sugiyama has written a primer on the use of Monte Carlo Simulation to assess forecast error. His simple illustrative example and description of the steps in the MCS procedure provide a non-technical overview of this fascinating approach to the evaluation of uncertainty in forecasts. For regression modelers specifically, Sam shows how MCS can be used to develop more realistic prediction intervals than the theoretical PIs found in books and software. - Advantages Of The Mad/Mean Ratio Over The Mape by Stephan Kolassa and Wolfgang Schütz
Stephan Kolassa and Wolfgang Schütz provide a careful look at the ratio MAD/Mean, which has been proposed as a substitute metric for the MAPE in the case of intermittent demand series. They explain how MAD/Mean can be viewed as a weighted mean of absolute percentage errors and thus as a weighted alternative to MAPE. They describe several advantages of MAD/Mean to the MAPE including applicability to inventory decisions, absence of bias in method selection, and suitability for series with intermittent as well as near-zero demands. - Recent Studies On Forecasting Know-How, Training And Information Sharing by Paul Goodwin
New to Foresight with this issue is the column Hot New Research, written by Paul Goodwin. In each issue, Paul will summarize several new articles that address issues of importance to the forecasting practitioner. The focus for this initial column is on forecasting performance in organizations, and how forecasting knowhow, training, and information sharing can improve forecasting accuracy and achieve cost savings. - Forecasting The 2006 Democratic Party Takeover Of The U.S. House Of Representatives by Carl E. Klarner And Stan Buchanan
Carl Klarner and Stan Buchanan (K&B) have applied an innovative approach to predicting congressional elections by pooling candidate, district-level, and national variables. National tides favored the Democrats in 2006, in the form of pro-Democratic voting intentions, low presidential approval ratings, and moderately slow growth in real disposable income. More than 6 months prior to the election, the K&B model predicted a 22-seat gain for the Democrats with a 95% chance that the party would take control of the House. The final tally gave the Democrats a gain of 30 seats, far above the 15 seats required for the party to recapture the House.
- Confessions Of A Pragmatic Forecaster by Chris Chatfield


