

Nicholas G. Reich1, Ryan J. Tibshirani2, Evan L. Ray1, Roni Rosenfeld2
1 Department of Biostatistics and Epidemiology, University of Massachusetts Amherst
2 Machine Learning Department, Carnegie Mellon University
Correspondence to: Nicholas G Reich, email: nick@umass.edu and Ryan J Tibshirani, email: ryantibs@cmu.edu
In a nutshell
The US COVID-19 Forecast Hub has served as a central repository for forecasts of COVID-19 in since April 2020, collecting predictions of state-level cases, hospitalizations and deaths for 4 weeks into the future. We conducted an analysis that evaluated probabilistic accuracy of the ensemble forecast generated by the Hub each week. Short-term forecasts of COVID-19 deaths showed reliable performance across all horizons. However, forecasts of cases and hospitalizations showed repeated, sustained lapses in accuracy for longer-term forecasts, especially at key points during some the larger pandemic waves. Therefore, starting in September 2021, the Hub decided to suspend the inclusion of 2 through 4 week ahead case forecasts and 15 through 28 day ahead hospitalization forecasts in the official ensemble that is generated every week. Modelers and forecasters should continue to innovate and investigate so we can continue to build our understanding of how models can be used to anticipate changes in COVID trends and serve the needs of decision-makers and the general public.
The authors of this post are the directors of the two US CDC-funded Centers of Excellence for Influenza Forecasting, and include the leaders of the Forecast Hub effort.
A brief history of COVID forecasting in the US
In April 2020, we launched the US COVID-19 Forecast Hub, a central repository of short-term forecasts of COVID-19. In the past 18 months, we have collected over 70 million unique predictions of the short-term trajectory of COVID-19 cases, hospitalizations, and deaths in the US at the state and county level.
We have just started to scratch the surface of these data to gain insights into what has and has not worked, and where and when these forecasts have been accurate and not. You can browse the interactive Forecast Evaluation Dashboard (developed by the CMU Delphi group in collaboration with the Hub) to see individual model evaluations. You can also check out our preprint evaluating forecasts of COVID-19 deaths. We also release a forecast evaluation report on the Hub website every month. The full forecast dataset, made available on our GitHub repository, is entirely public, and we hope to see additional analyses take advantage of this trove of data.
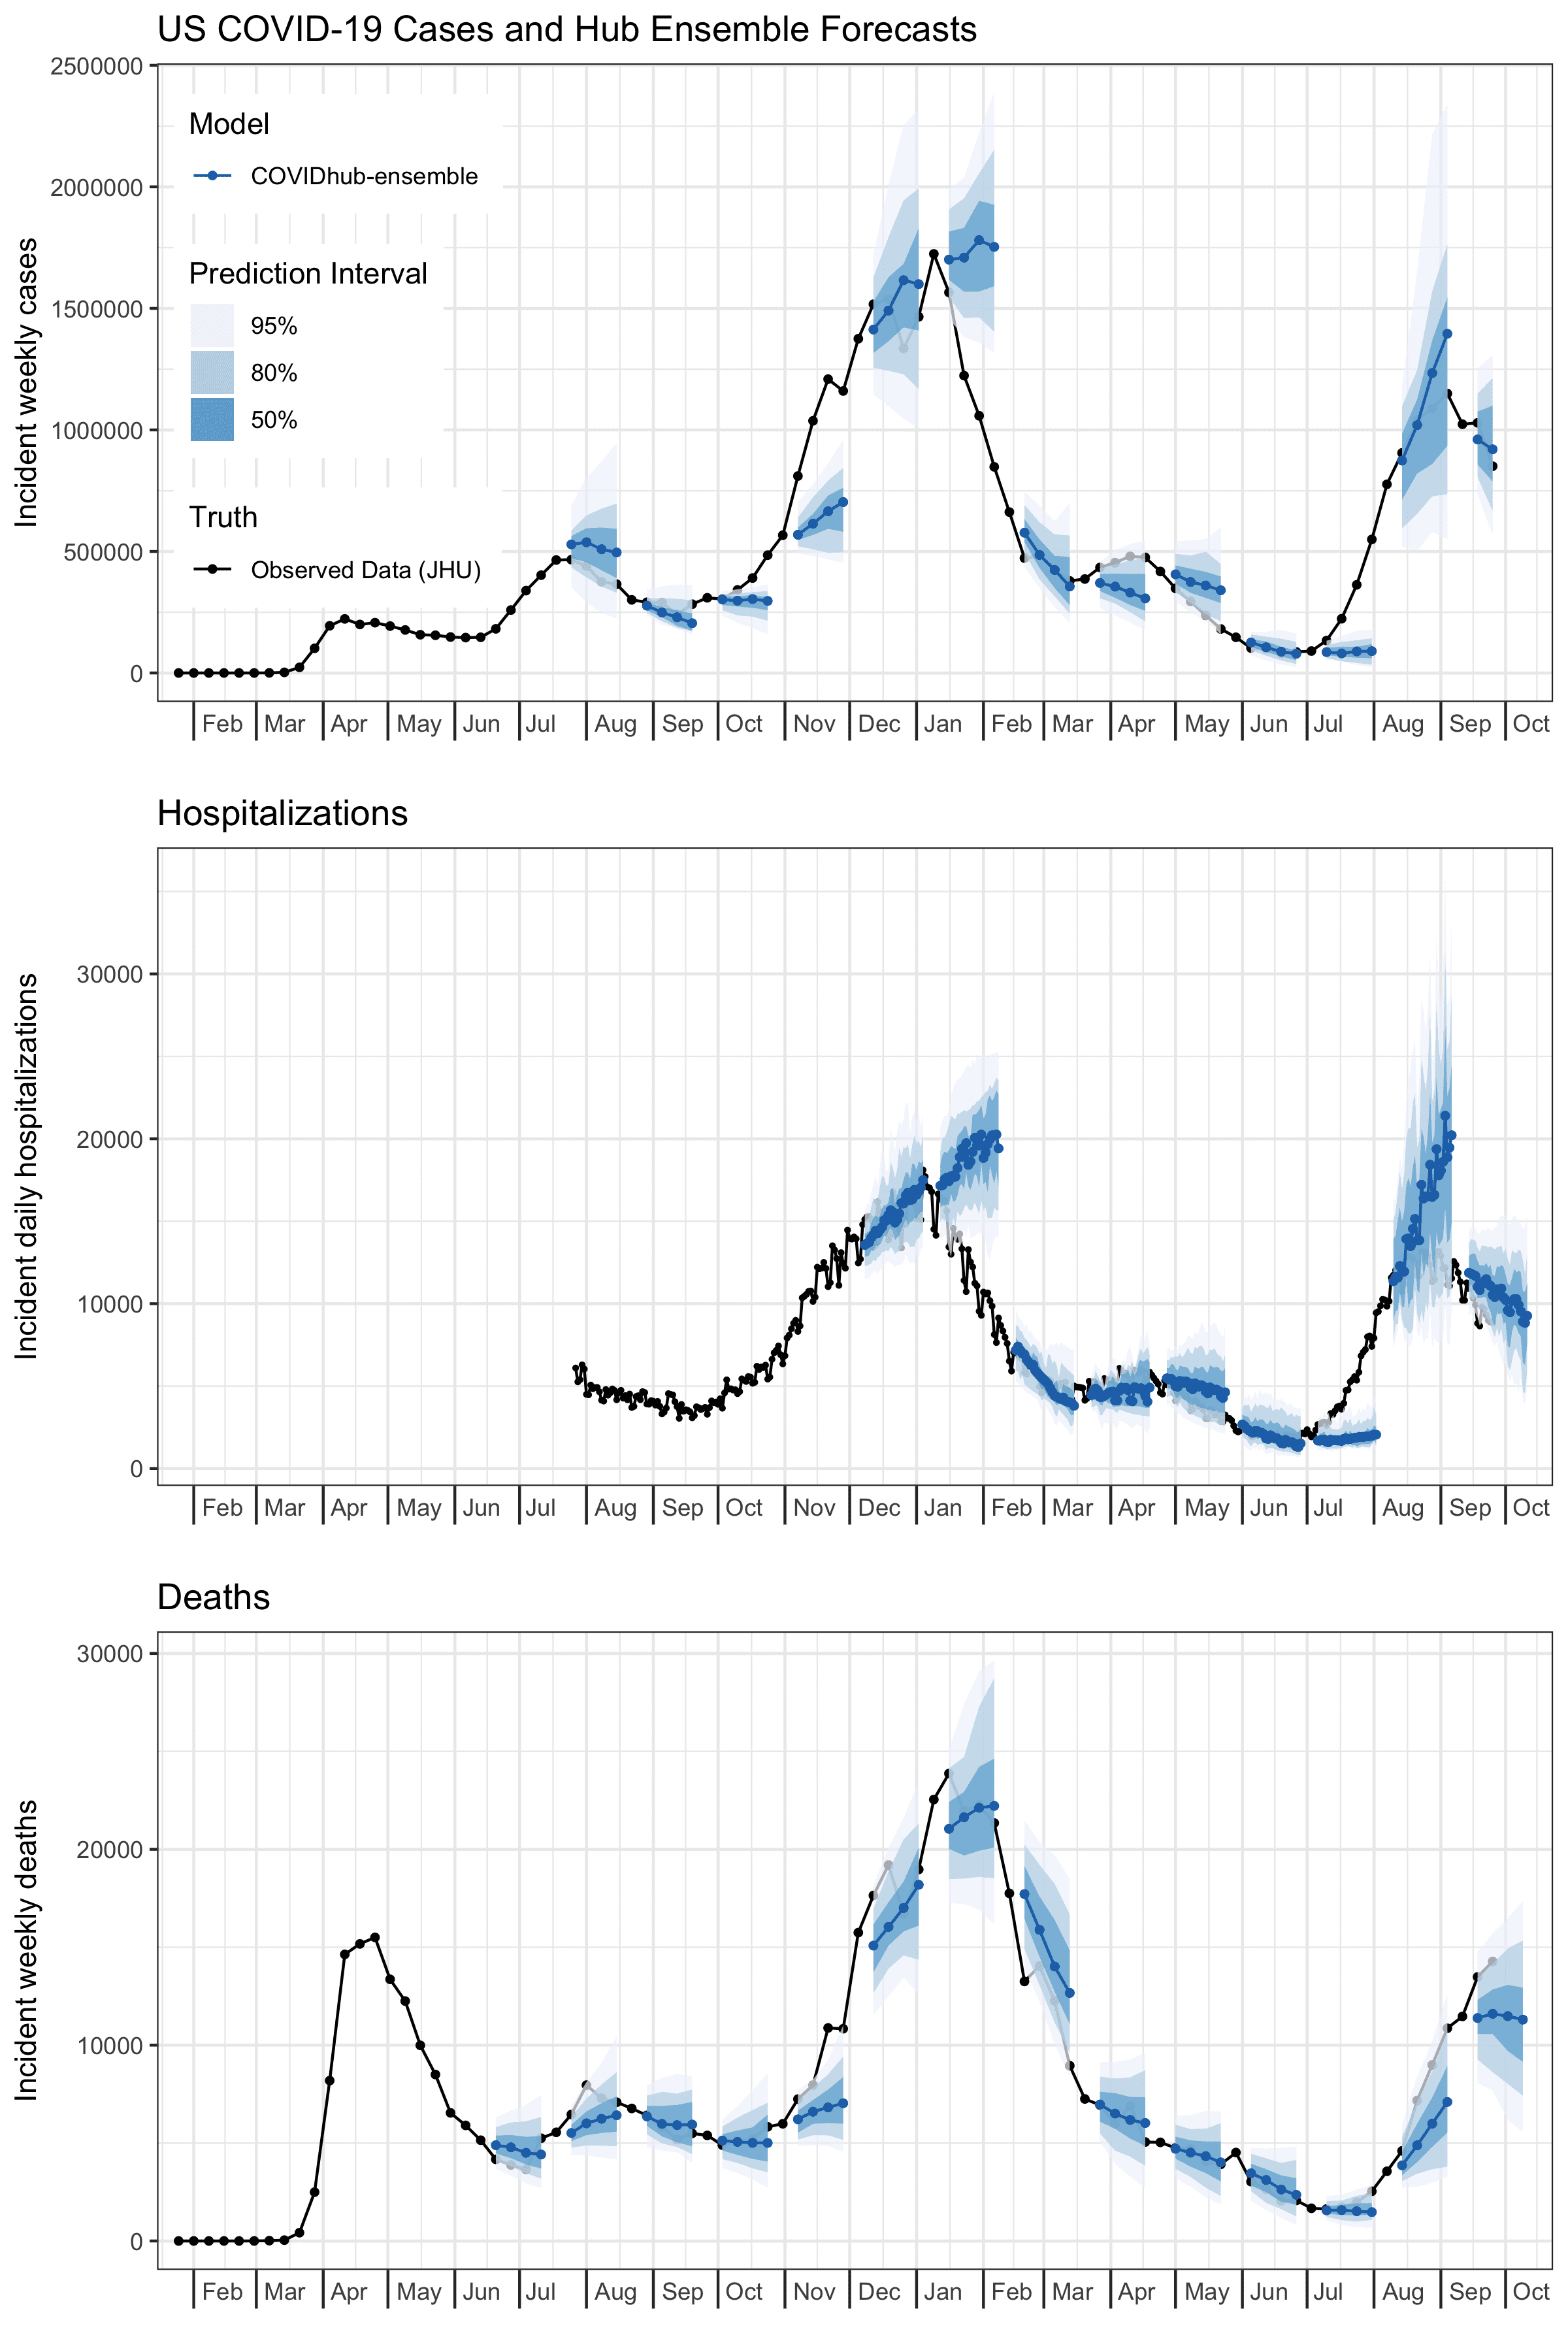
A key feature of the Forecast Hub is that we assimilate predictions from all submitted models in a given week to create a single “ensemble” forecast. These ensemble forecasts are communicated every week by the US CDC. A selection of these forecasts are shown in the figure below. Note that due to an early decision in formatting, hospitalization forecasts have been made at the daily level, whereas case and death forecasts have been made at the weekly level.
We have noticed over the past year and a half that the ensemble has at times shown very low accuracy, in particular at times when forecasts would be most useful, i.e., times of dynamic increases and decreases in COVID-19 activity. This has been especially true for cases, but to some extent is also a problem with hospitalizations, and to a lesser extent with forecasts of mortality. Extensive exploration into approaches that could be used to weight individual models to achieve improved performance (this is work that is still ongoing) has not shown major improvements in accuracy.
These observations have led us to decide to produce ensemble forecasts for shorter horizons into the future, starting in September 2021. For cases, we started out in July 2020 making forecasts for up to 4 weeks into the future. This decision was based in part on our experience forecasting influenza in collaboration with CDC in prior years. However, based on a preliminary evaluation in late August, on 6 September 2021 we decided to shorten this horizon so the official COVID-19 Forecast Hub ensemble forecast only provided 1 and 2 week ahead case forecasts. As of 27 September 2021, the ensemble only produced a 1 week ahead case forecast and up to 14 day ahead hospitalization forecasts. We continue to generate forecasts at horizons of up to four weeks ahead to support scientific understanding of forecast skill at these longer horizons, but we will not present these in the Hub’s routine communication products. These are stored in a separate forecast model. This post, focusing on state-level forecasts, documents the analyses that have supported these decisions.1
We started the Hub effort not because we thought we or anyone else could make incredibly accurate long-term forecasts of COVID-19. In fact, we were pretty sure that this was going to be really hard. Now, the data in the Hub enable us to clearly and rigorously document the successes and failures of these forecasting approaches.
Ensemble forecast performance
Two measures that are easy to compute given the quantile-based format of our forecasts are prediction interval coverage and a measure of accuracy of a given model relative to a baseline. The baseline in our case is a simple model that propogates the last observed value forward, with wide uncertainty bands around this value. As we have used in other work evaluating the forecasts, we relied on the weighted interval score (WIS) as the key measure of accuracy. WIS can be seen as a generalization of absolute error, that measures the distance between the predicted distribution and the eventually observed data, in a way that reflects both calibration and sharpness. As such, lower values of WIS are better.
In particular, we are interested in whether the ensemble:
- consistently achieves prediction interval (PI) coverage, at the 95% level; and
- consistently makes better predictions than the baseline, according to WIS.the overall mean WIS for each model.
Ensemble prediction interval coverage
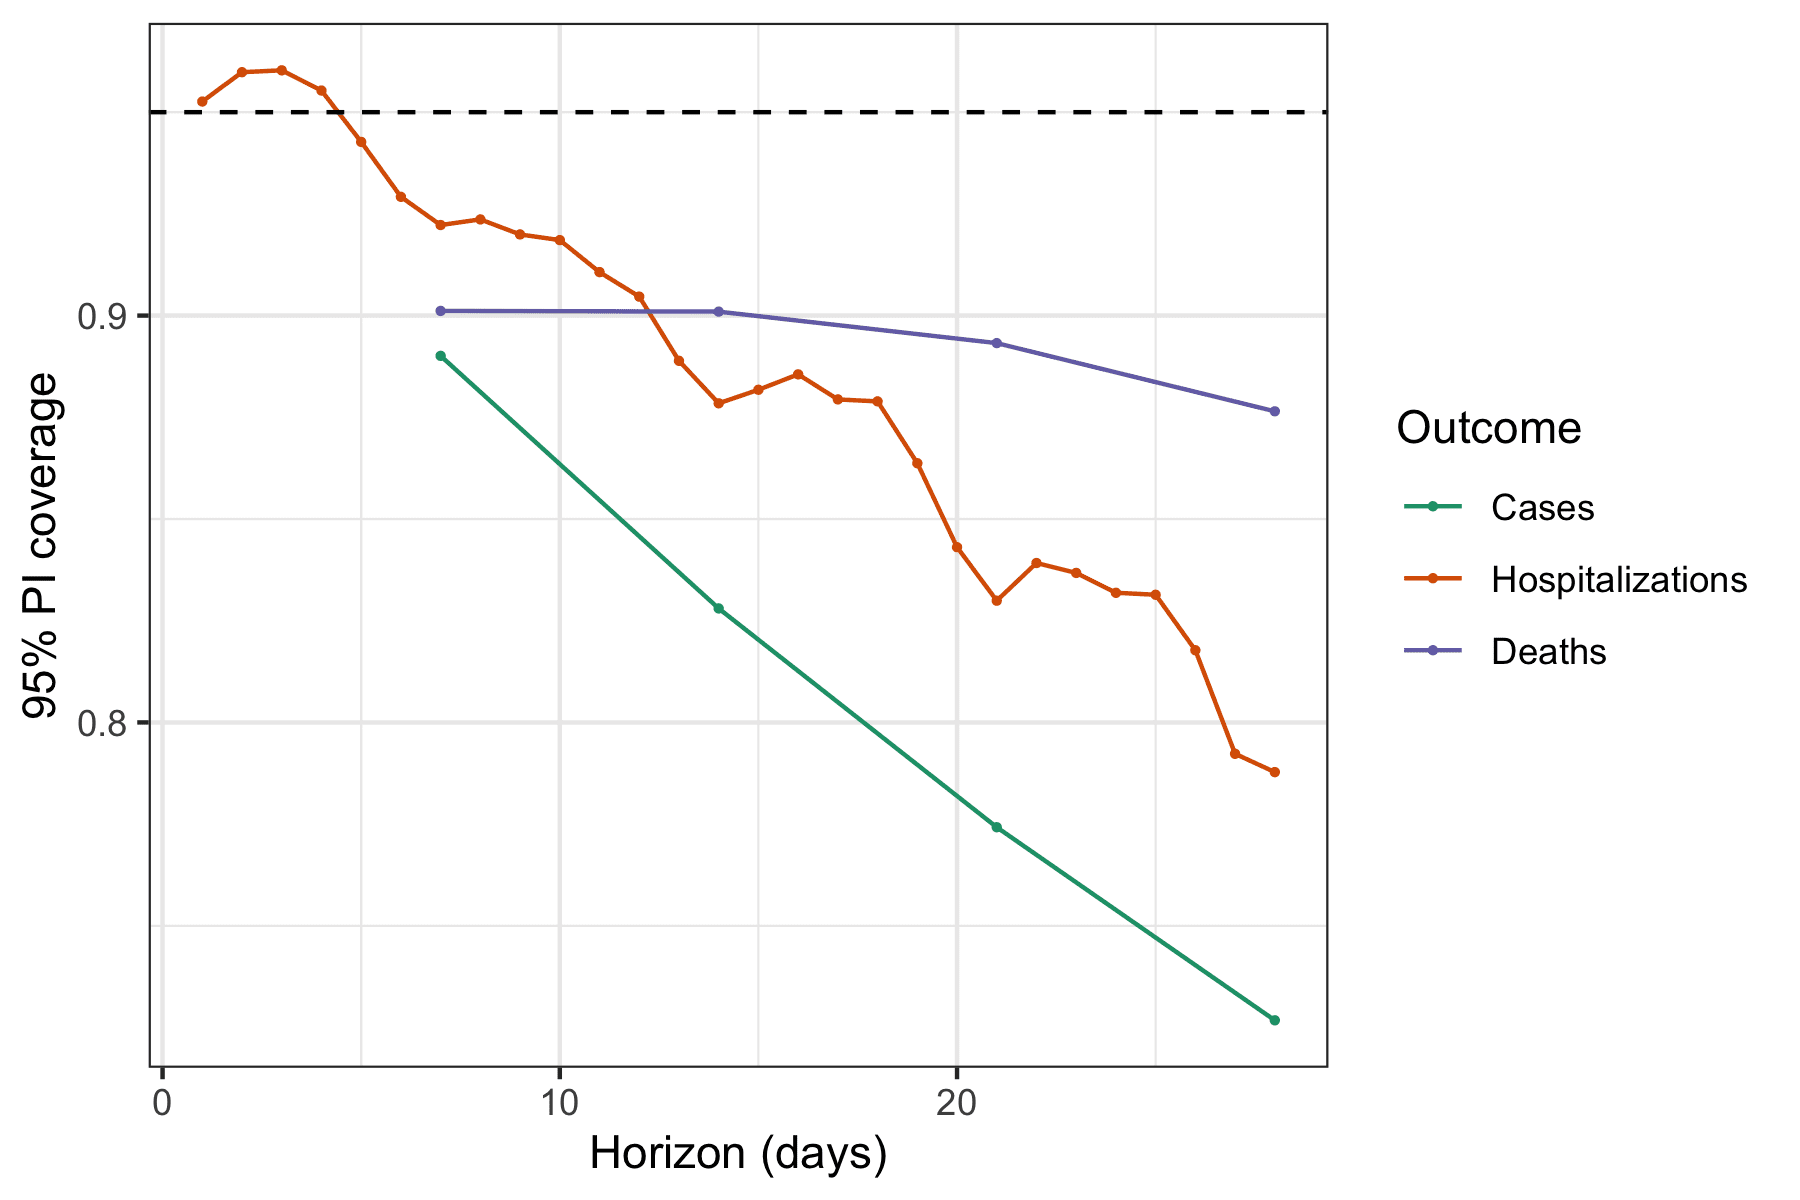
Across all forecasted outcomes (cases, hospitalizations, and deaths) and nearly all forecast horizons, the ensemble has historically generated 95% prediction intervals that covered the truth less than 95% of the time. See the figure below. The only exception is that since December 2020, the 1 through 4 day ahead forecasts for new hospitalizations have shown just higher than 95% coverage. Coverage rates across all time for all outcomes are all reasonable (if slightly low) at a one week horizon (between 89% and 92%) but decline the further you you look into the future. The slope of that decline is particularly steep for forecasts of cases, which show below 80% coverage rates at 3 and 4 week horizons, and least steep for deaths which show 88% coverage at 4 weeks ahead.
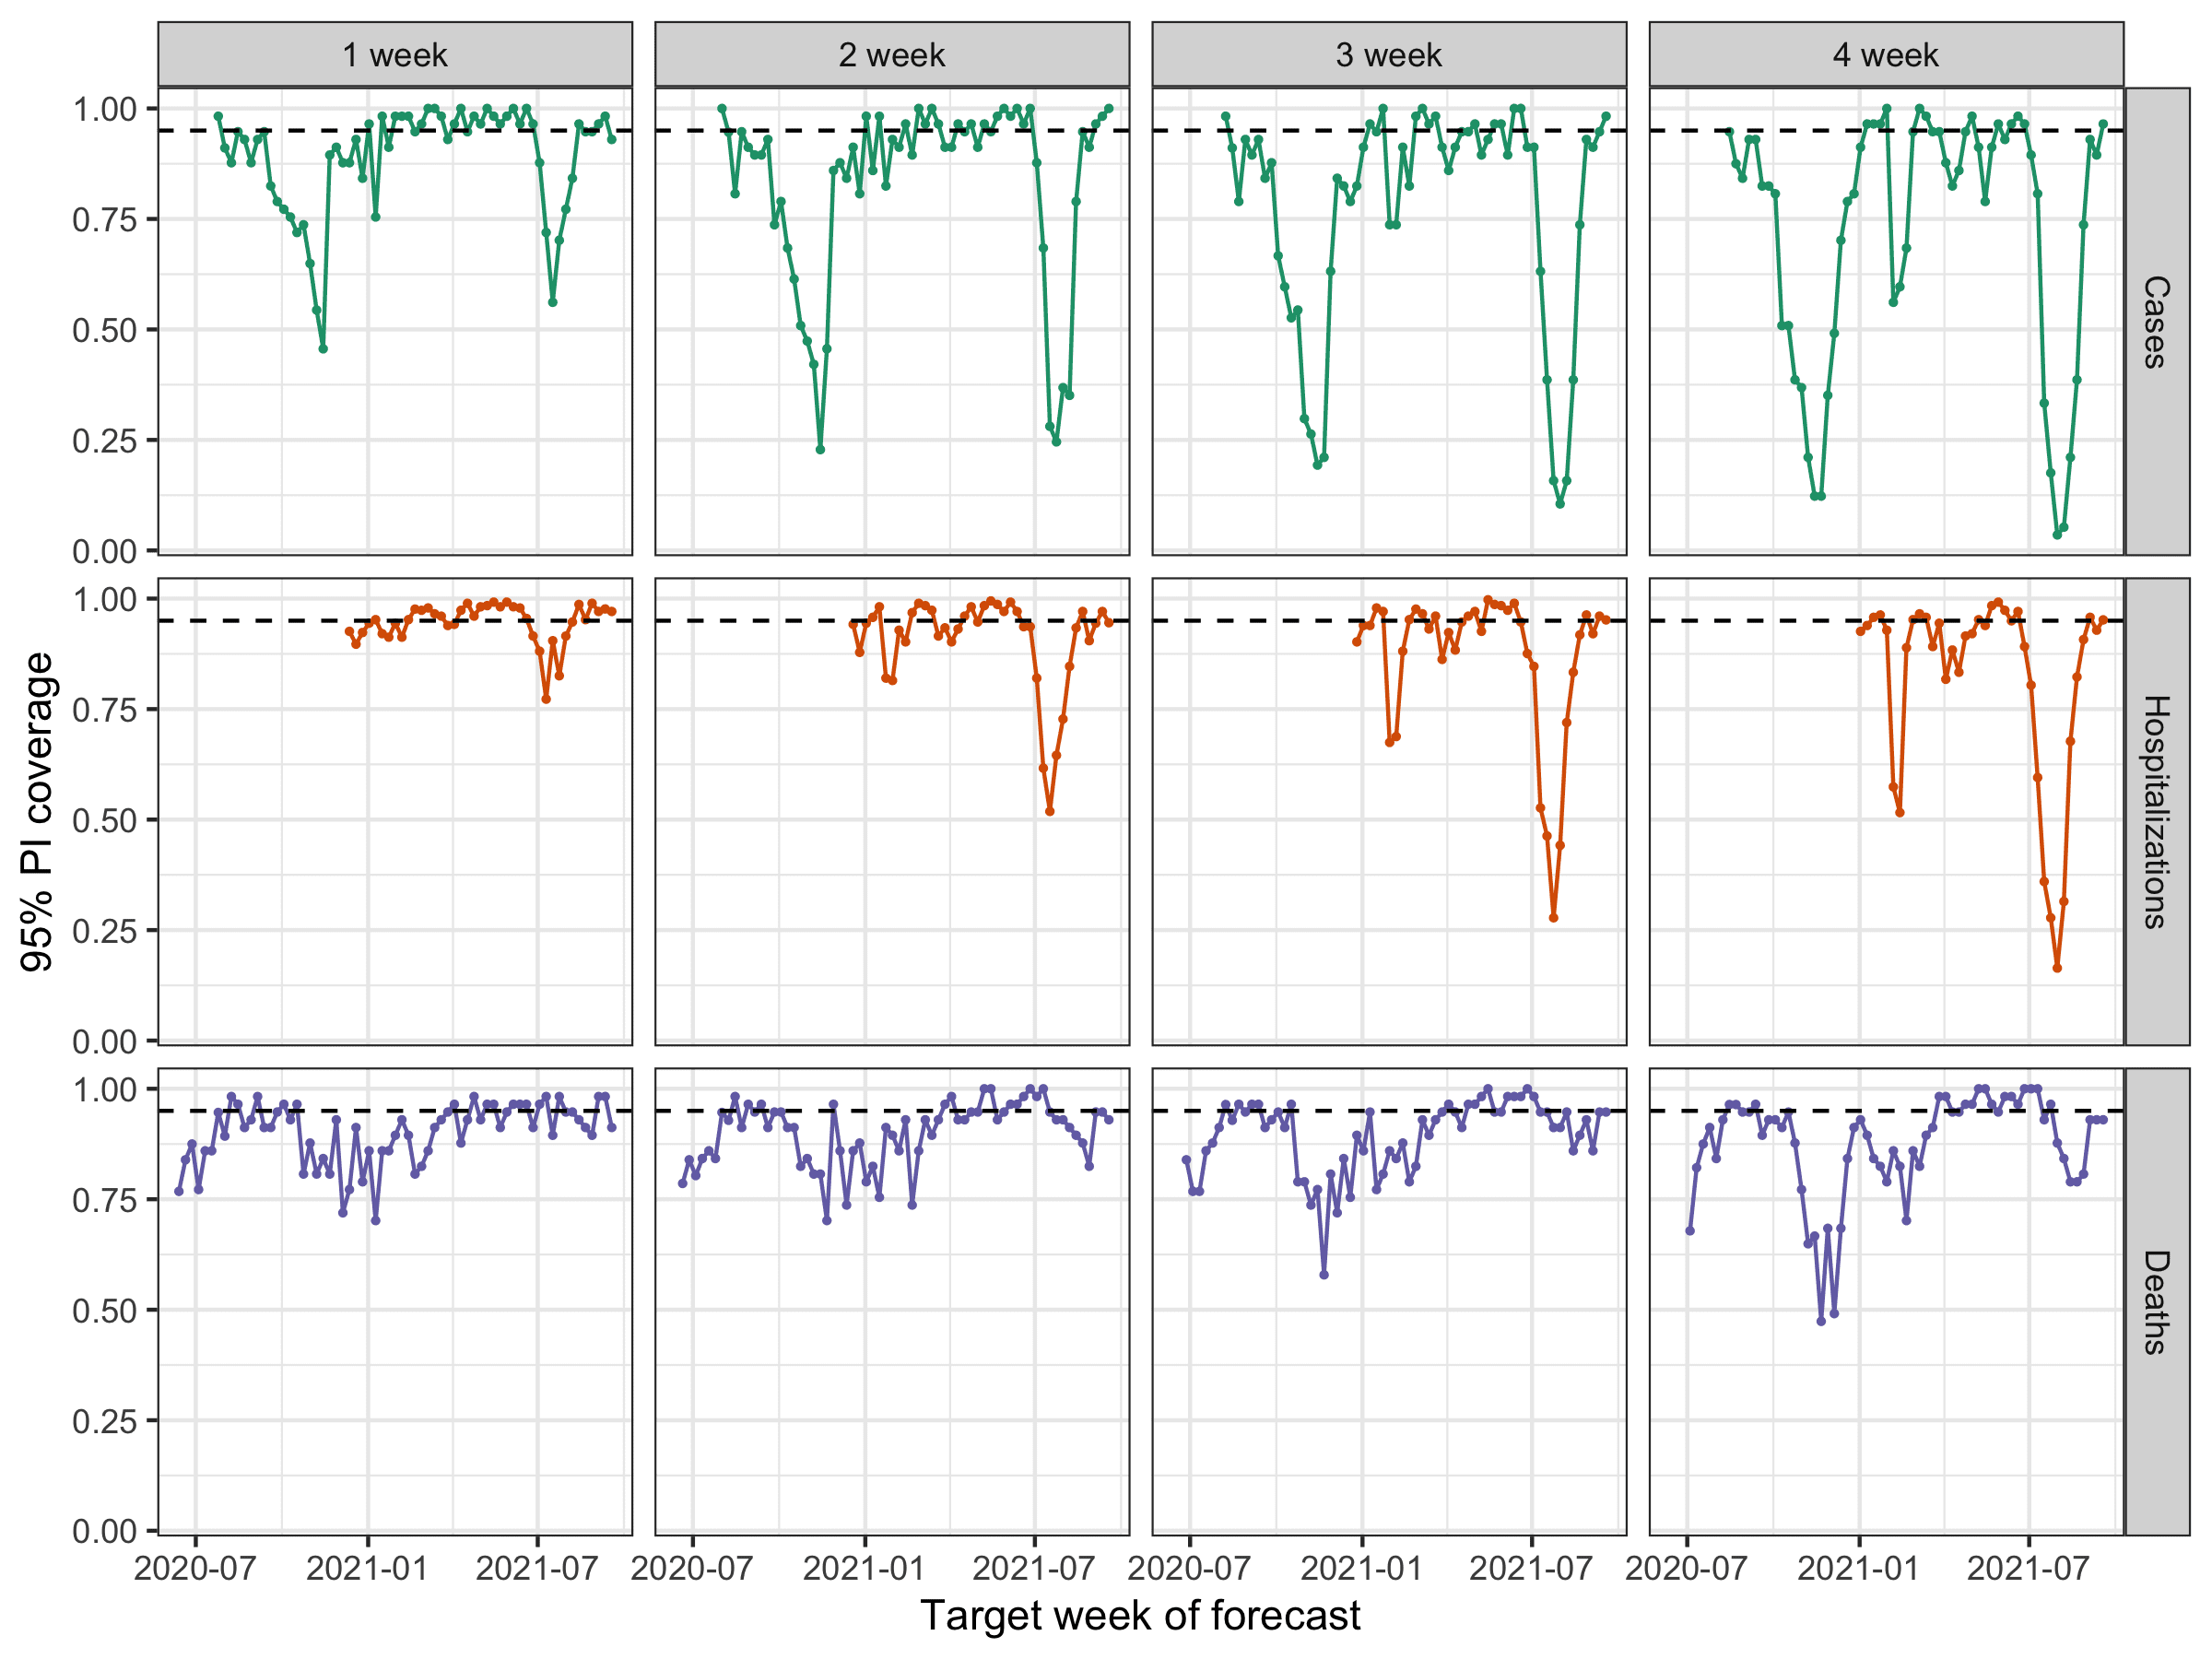
When you look at the same numbers split up by week, sustained periods of lower coverage rates (e.g., less than 50%) are visible for every outcome except for deaths, with the lower rates being more pronounced at the longer horizons (each horizon is a column in the figure below). Lower rates for one week here and there might be expected. After all, these outcomes across all states in the US are all highly correlated within a given week, and we must not fall prey to the forecaster’s dilemma by only focusing on weeks with low-probability outcomes. That said, failures by a model in multiple consecutive weeks and during multiple distinct “waves” of the pandemic indicate that there is systematic miscalibration of these models at certain horizons. Additionally, they are not able to successfully anticipate period of rapid changes (either upwards or downwards) in trends of outcomes. This is corroborated by revisiting the example forecasts from the first figure in this blog post.
Ensemble accuracy with respect to a baseline model
It is also important to assess how much information the ensemble is providing relative to a very naïve baseline model. We have built a simple model that propogates the last observed value forward, i.e., its point prediction is simply a flat horizontal line, with wide uncertainty bands around this flat line that are based on the historical observed changes in consecutive observations. (For more detail, see our preprint.) We compute a measure that we call the relative WIS that divides the average probabilistic accuracy (WIS) achieved by the ensemble by the average accuracy achieved by the baseline. If, on average, the ensemble is more accurate (i.e., has lower WIS) than the baseline, the relative WIS will be less than 1.
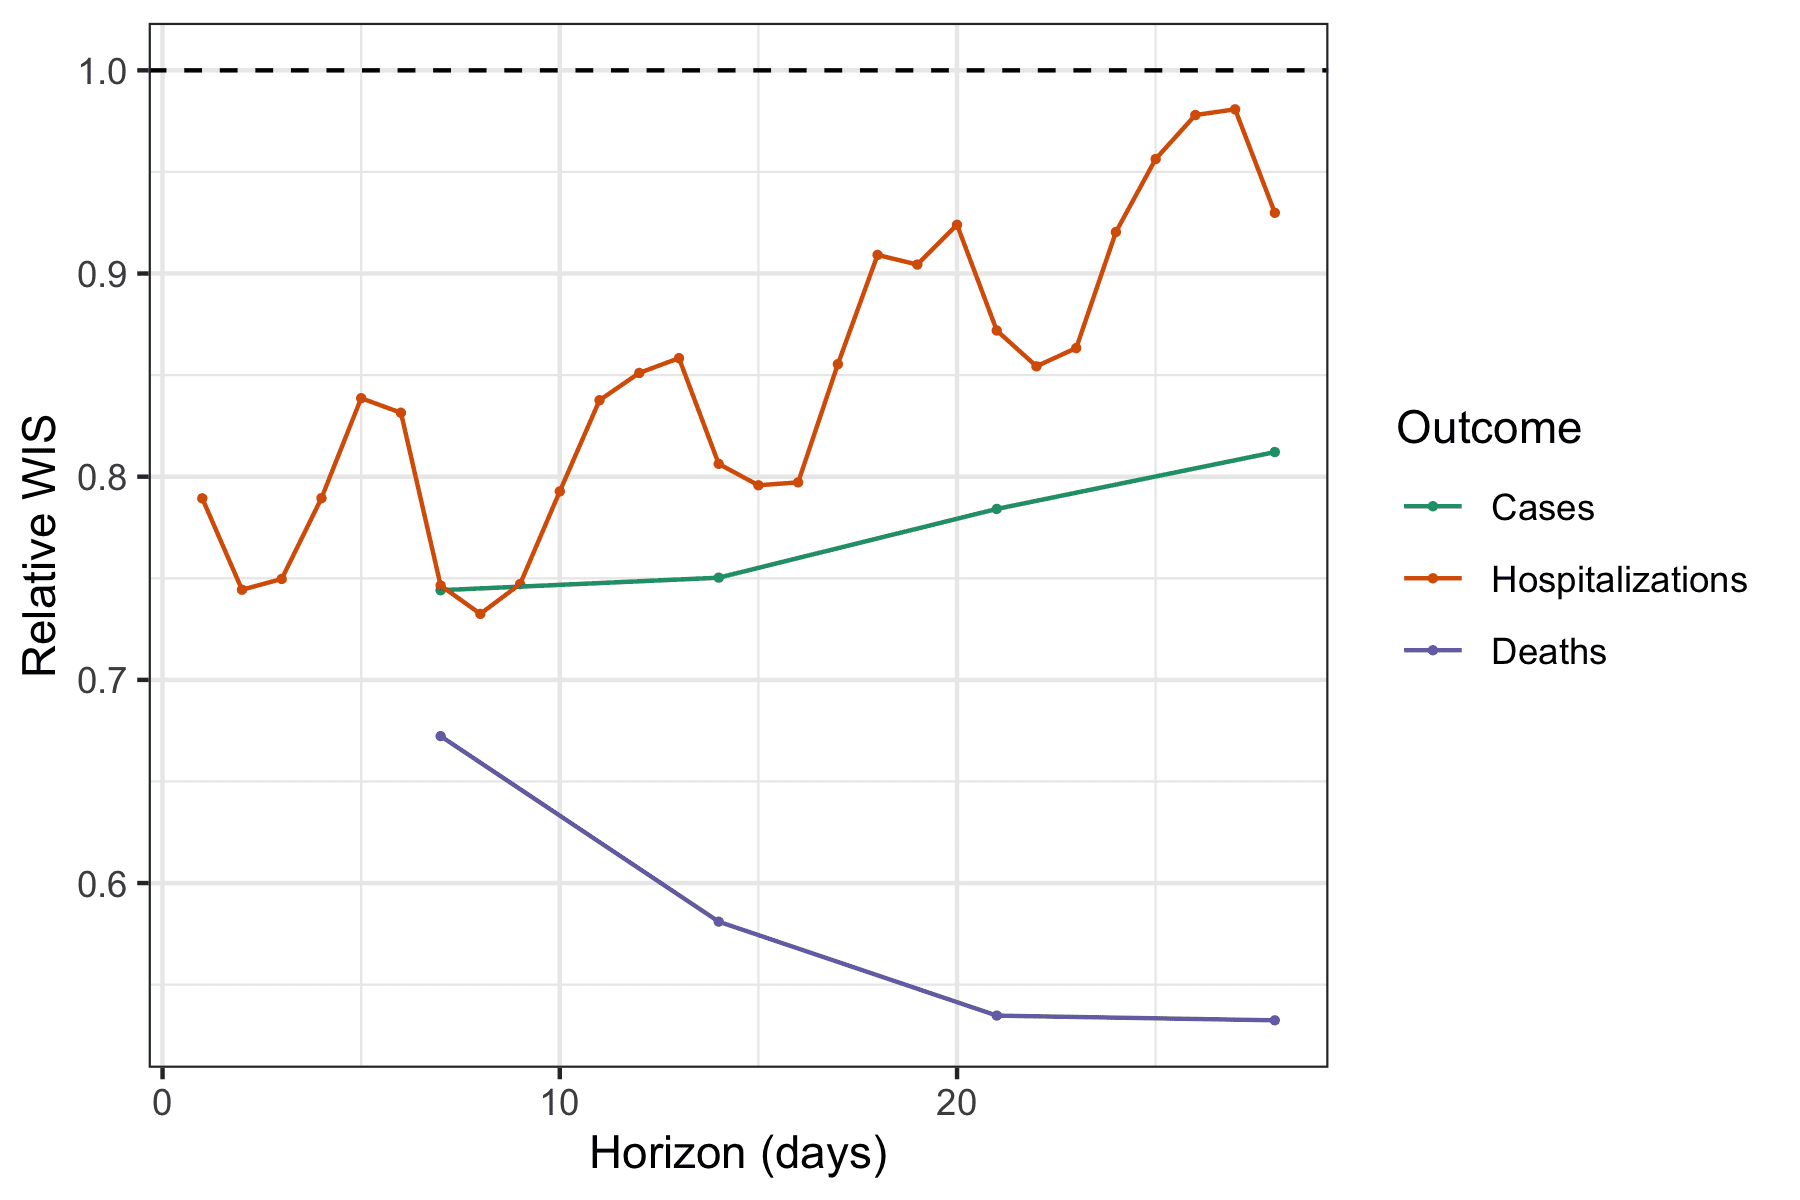
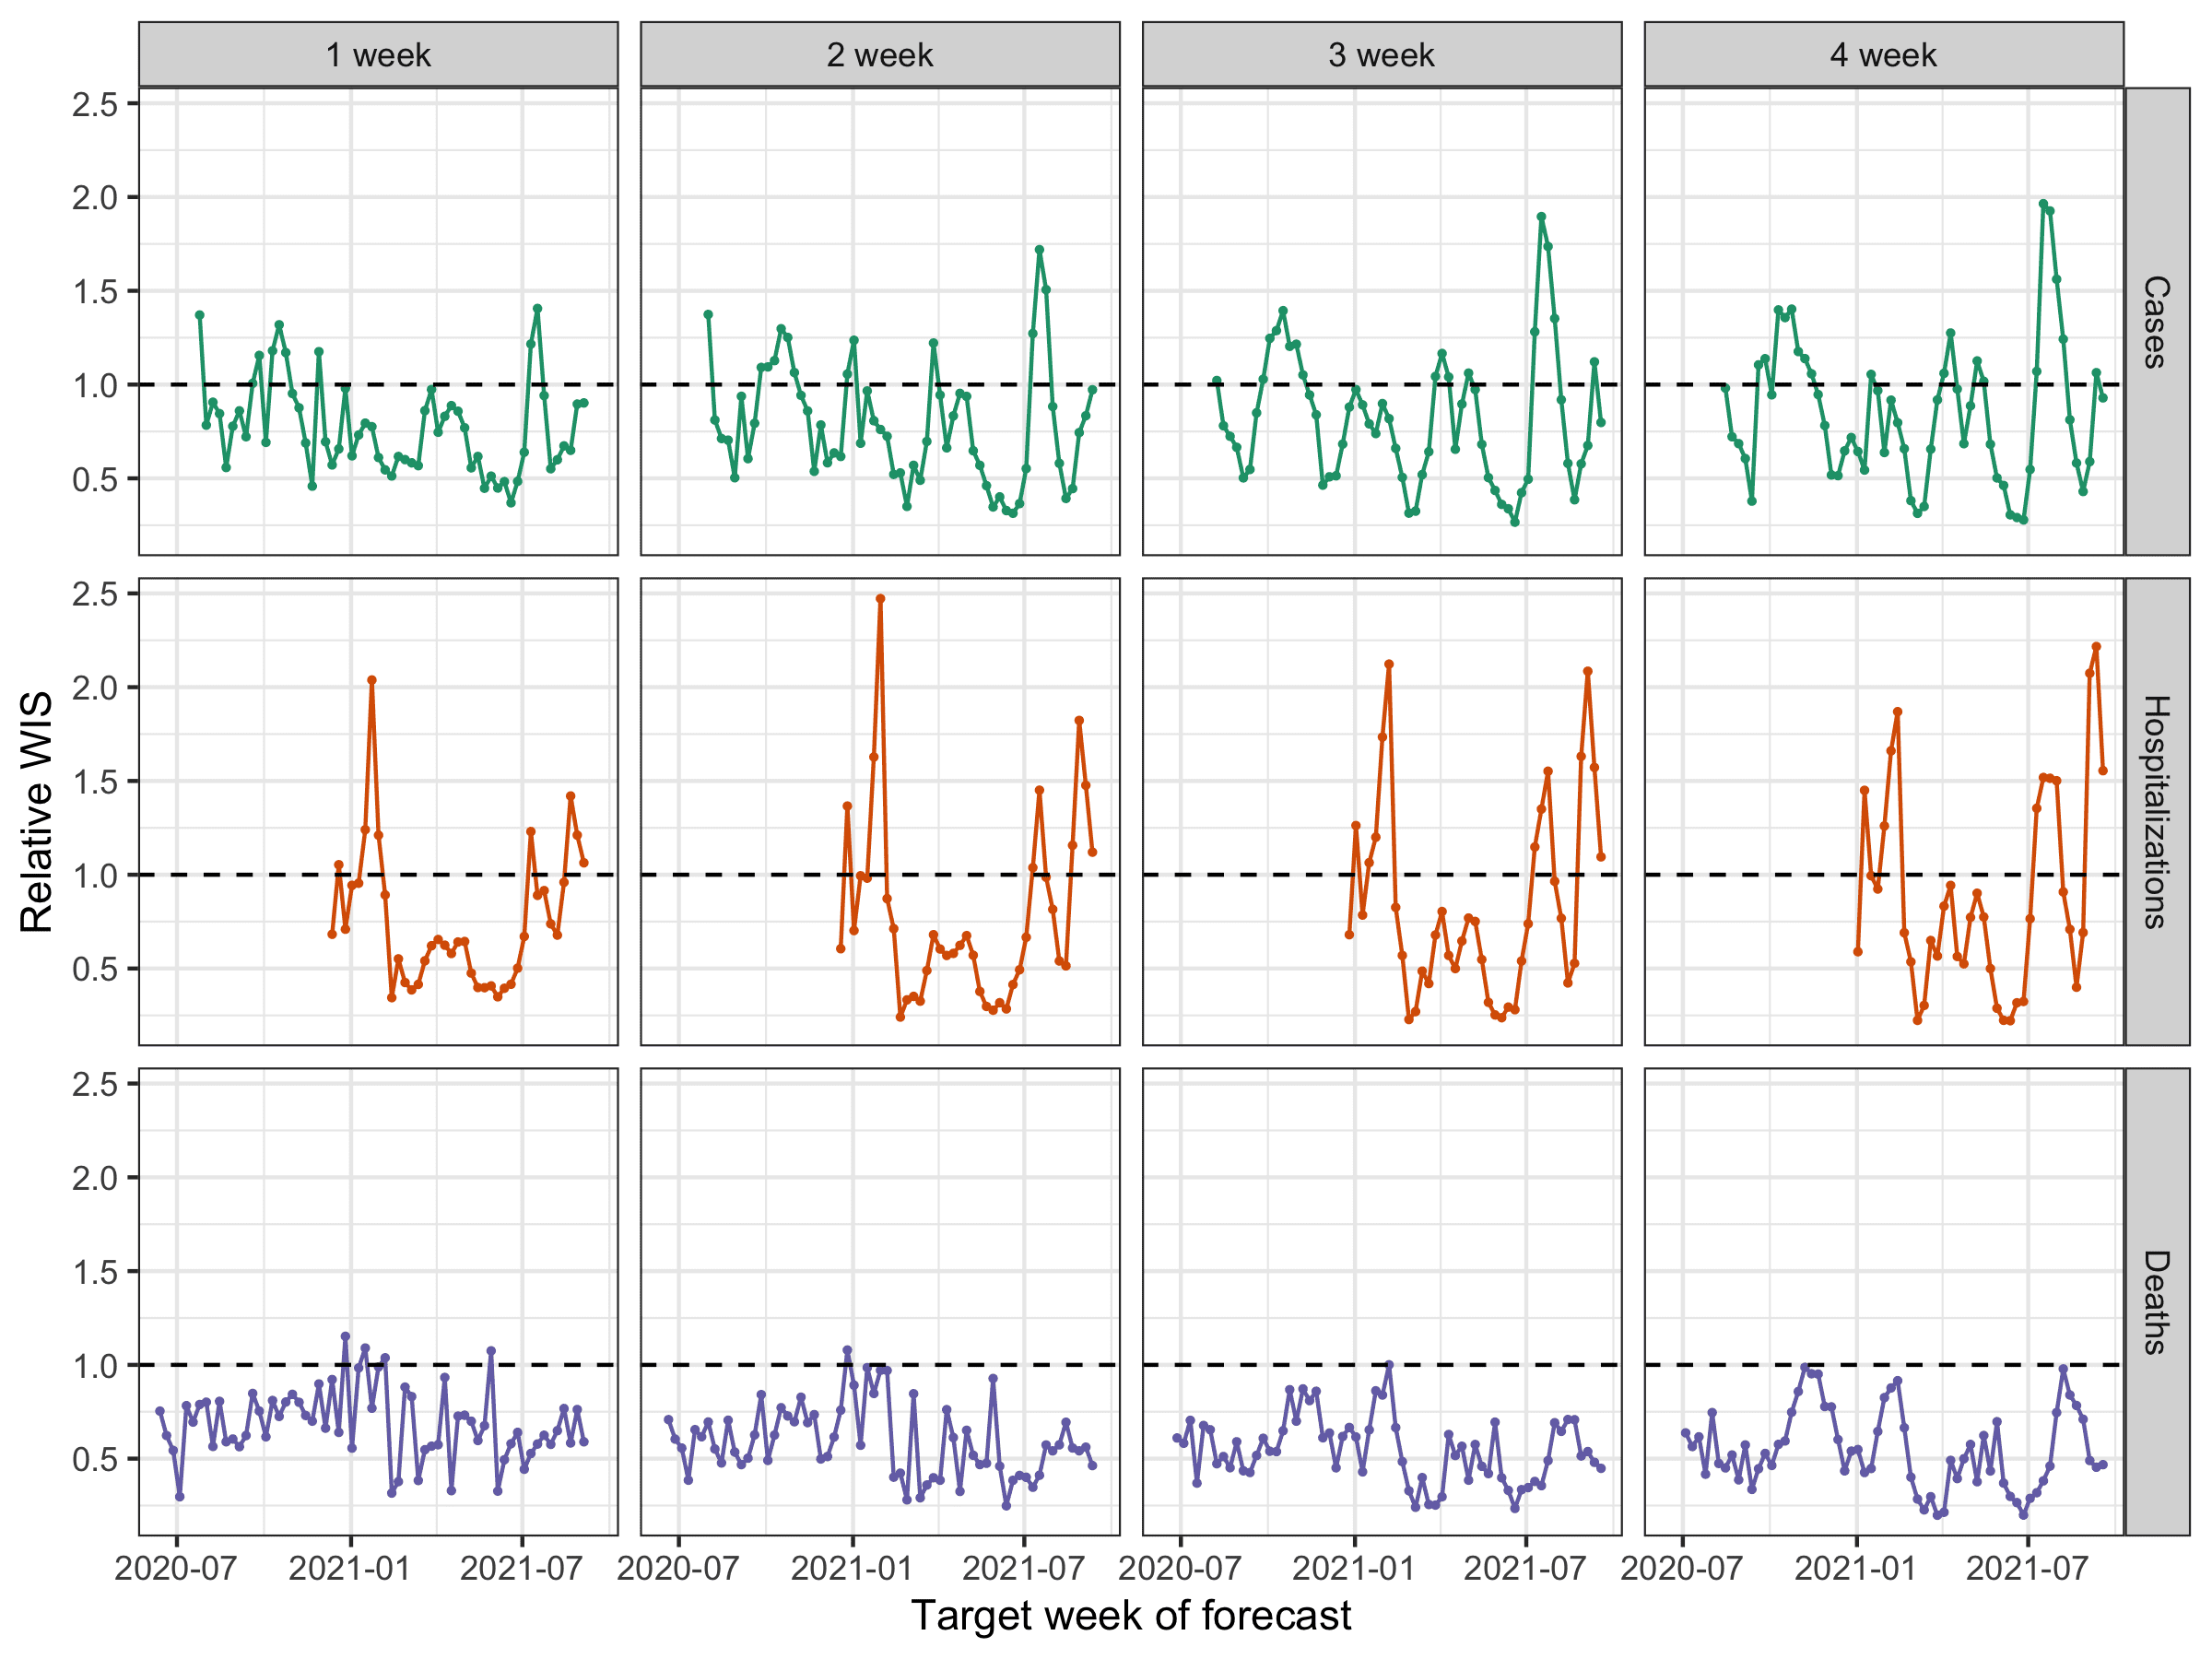
For all outcomes and horizons, the ensemble on the whole has provided more accurate forecasts than the baseline (see figure below). Interestingly, the accuracy relative to the baseline increases with forecast horizon when forecasting deaths, from 33% improvement over the baseline (relative WIS = 0.67) to a 47% improvement (relative WIS = 0.53). Meanwhile, the average performance of the ensemble across all weeks became less accurate relative to the baseline at longer horizons for both cases and hospitalizations (though it always remained more accurate than the baseline in absolute terms on average).
Again looking across weeks, we see that ensemble forecasts of deaths are nearly always more accurate than the baseline. On the other hand, the case and hospitalization forecasts showed multiple weeks where forecasts were less accurate than baseline, especially during the most recent Delta wave of the pandemic and at longer horizons (each weekly horizon is a column in the figure below). One caveat for the baseline model for hospitalization data is that because it is based on daily data that has more observational noise and day-of-week effects, the baseline performance is more highly variable than for the other outcomes. The relative WIS calculations in the figure below aggregate the daily WIS values by week to compute a weekly aggregate relative WIS.
We did not use any specific pre-established criteria in order to decide to suspend all but 1 week ahead case forecasts and up to 14 day ahead hospitalization forecasts.2 After looking at the plots above, we settled on an informal “rule” that for a forecast to be seen as reliable enough to publicly communicate, it should never have more than 3 consecutive weeks of 95% prediction intervals with coverage below 50%. Virtually all of the suspended targets failed to meet this criteria. As proper coverage can be trivially achieved by a forecaster that outputs hugely wide prediction intervals, we were also looking at relative WIS (recall that WIS reflects both calibration and sharpness) to see evidence that the ensemble forecasts were reliably adding value above and beyond a very naïve model. These plots are harder to interpret, especially for hospitalizations (as day-of-week effects add noise to both the ensemble and baseline forecasts). But they show that death forecasts are nearly always more accurate than the baseline model at all horizons, while case and hospitalization targets, particularly at longer horizons, fail to improve over the baseline at various points in time.
What comes next
As we mentioned earlier, these analyses have led us to turn off specific targets within the official COVID-19 Forecast Hub ensemble. It has forced us to grapple with the fact that we are simultaneously running an operational forecasting system that is being actively consumed by public health decision-makers and the general public while also conducting research to improve our understanding about just how predictable certain aspects of this pandemic are.
We will continue to look at and monitor individual and ensemble model performance in coming months. If we see strong evidence that models have improved their ability to forecast period of dynamic change in the pandemic, then we will revisit the question of how far into the future these models should be forecasting. However, it is important to keep in mind that the longer-term (i.e. 3 to 4 week ahead) forecasts can appear accurate for many months in a row (see figures above) only to then suffer from a period of sustained poor performance. To be convincing for us, evidence will likely need to include forecasts during both the up- and down-swings of another wave of COVID-19.
We have spent a lot of time looking into ways to improve our ensemble forecast accuracy. A lot of our research energy over the last year and a half has focused on thinking about ways to assign different weights to individual models to improve accuracy. This work is still ongoing, and has yielded modest improvements in accuracy, depending on the target, but not significant enough for us to change our operational model, which treats every forecaster equally in creating the ensemble. We are just now starting to look into approaches where we might recalibrate the ensemble forecasts by making adjustments to the predictive distribution based on previous errors the ensemble has made. Changes that we make here might improve prediction interval coverage (stay tuned for new results on this in upcoming months!), but this could also end up creating such wide intervals that the ensemble forecast loses utility for real decision-making.
A reasonable question to ask when the ensemble is failing is: “are other models doing better?” We have looked into this really carefully for deaths, and the answer is pretty clearly “no”. For other outcomes, we have not yet run as thorough analyses. For cases, the LNQ-ens1 model for many weeks outperformed the ensemble, but it stopped submitting forecasts to the Hub in early June 2021. The Karlen-pypm model, in part by integrating current data on circulating variants, also has been able to predict the trajectories of upswings of COVID cases fairly accurately, although the model often then dramatically over-predicts when the curve is near the peak. Other models occasionally outperform the ensemble, even for multiple weeks in a row, but then have periods where they perform much worse than the ensemble. It is important to remember that recent performance it not always a great predictor of future performance, for both individual models and the ensemble.
We must not let some of the failures of forecasting impugn the many very important and useful modeling efforts that have supported decision-making and provided valuable real-time information about this ever-evolving crisis. We visit covidestim.org or epiforecasts.io often to get a sense of current trends based on the imperfect recent data. Models have helped us get a sense of the true death toll of the pandemic and of the risks of severe outcomes in different demographic groups. Models that have made longer-term, assumption-laden projections warned us about the risk of new summer waves in the US, and forecasts of mortality have made it clear when grim milestones are inevitably on the way.
Looking forward, some of the most important research that could be conducted to help improve forecasting would illustrate what data streams are able, in retrospect, to explain some of the variation and trends in COVID-19 transmission. This is a complicated and intricate problem, one that—like the Hub—will require multiple efforts from many research teams using different approaches, to hopefully converge on an answer. Some of our own analyses in this realm revealed that indicators derived from various digital surveillance streams can indeed offer modest improvements in case forecasting accuracy; but somewhat paradoxically, these improvements are most pronounced during periods of stability in case activity, and often break down during times of rapid increases in case trends (which is exactly when we would be looking for the most help). Much more work in this realm is needed, and eventually, we believe that these kinds of studies will be vital in improving our epidemic models in the future.
Short-term COVID-19 forecasts of cases, hospitalizations, and deaths have had moments of good accuracy and also, especially for longer-term case and hospitalization forecasts, their fair share of misses. However, we know that the broader modeling community is not ready to throw in the towel. There is a lot of work to do over the coming months and years to improve these models, the forecasts, and our understanding of how to use them. So you might say that our small but blossoming field has just entered a new era, and in this sense, we are just getting started.
1 We note that the CDC has adopted their own set of criteria for whether to communicate forecasts in a particular week. Those criteria change over time, so they might communicate only 1 week ahead case forecasts in some weeks, but 1 through 4 week ahead case forecasts in other weeks. The CDC has also added a strong disclaimer to their communication of forecasts.
2 We note that some of the plots in this section aggregate scores for daily hospitalizations within a week. Closer examination of data indicated that a 14 day cutoff, as suggested by the weekly prediction interval coverage plots above, is similarly supported by plots of daily horizon-specific performance (not shown).