

Antonio García-Ferrer, Universidad Autónoma de Madrid
This is a summary of a set of weekly reports (that I have been writing since 3/25/2020) about measuring and forecasting the effects of COVID-19 in Spain, one of the countries where such effects are being more pernicious. For comparative purposes, I will also analyse the data of China (Hubei) and Italy as references. In the three cases, my daily database is the one published by the Coronavirus Resource Center of the John Hopkins University.
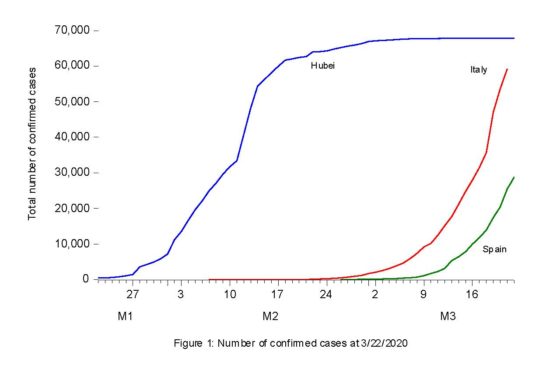
I will focus on three variables: the number of confirmed contagions (CON), the number of deaths associated to the illness (DTH), and the number of people recovered from it (REC). The starting dates of the time series for each country are different. Chinese data start on 1/22/20, Italian data begins on 2/7/20, and the first Spanish data appeared on the 2/26/20. Consequently, Chinese series have 16 data points more than Italian series (actually, 29 more data points since Italian data shows the same figure 3 during the first 13 days), and 34 data points more than the Spanish series. At this stage, these sample differences are crucial to understand the basic discrepancies among the three countries. By the time of my first report (3/25/20) the situation seemed to be under control for China, while Italy and Spain were starting their individual nightmares, as Figure 1 attests. While Hubei clearly followed a logistic model, Italy and Spain seem to follow an exponential pattern, whose simple long-run extrapolation would lead to a general contagion of the whole population. However, as epidemiologists very well know, at the initial stages of growth both curves are similar only to drift away considerably after reaching the inflection point, as we observe in the Chinese case. Regarding other countries at the same time, we also observed three areas (Japan, Hong-Kong and Singapore) that reacted very quickly to the burst of epidemics, another successful country like South Korea, and a large set of countries following (with different delays) the path initiated by China.
 The first question raised by most researchers since the early days of the pandemic is the quality of the data in terms of representativeness and reliability. In the case of Spain at least, it is obvious that the number of cases reported is considerably lower than the real ones (that remain unknown). If only by personal experience, I know no less than 80 cases that do no to show up in the official statistics. This global phenomenon has been analysed by many scientific publications, trying to extrapolate from observed to real cases. With some discrepancies, the multiplication factor ranges from 7 to 10. In the Spanish case, this amounts to a range between 700.000 to 1 million cases by the end of March. Still, notably inferior to the 7 million figure that Imperial College reported about the same date (https://www.imperial.ac.uk/mrc-global-infectious-disease-analysis/covid-19/report-13-europe-npi-impact/).
As regards reliability, questions and bones of contentions are open issues. For example, at the beginning, public opinion showed doubts regarding the low values of death cases in Germany as a ratio of its confirmed cases. Many suggest that German authorities did not consider deaths related to COVID-19 if deaths were associated to previous serious pathologies. Others claim that the good results are the consequence of more than 1 million weekly PCR tests throughout the whole period. These are open questions, which will surely be analysed by exhaustive epidemiological studies in the future. For the moment, I will consider our database as a possible random sample of the true unobserved data. However, Chinese data show certain anomalies that are difficult to explain. In particular, its daily growth rate of CON, which was oscillating between 15-18% by 2/14/2020, suddenly dropped to 3% the next day, remained at this level the following four days and, dropped again to 0.5% on the fifth day. Finally, its growth rate reached zero the following week. Certainly, this experience is unique because no other country has followed a similar path and raises serious concerns about the reliability of its data (https://www.aei.org/research-products/report/estimating-the-true-number-of-chinas-covid-19-cases/).
Analysis of the data
What evidence was available to infer that the Chinese experience shall be repeated in the cases of Italy and Spain? If so, can we anticipate the dates of possible inflection points in both countries? Given the nonstationarity of the original series, I will focus on the daily growth rates that give us the pandemic’s propagation speed. Their main statistical indicators (mean, median and standard deviation) are not very useful if we use the whole sample. Large differences between mean and median results; and in many cases, standard deviations are considerably larger than means. This is why I have aggregated data in weeks where the evaluation of the main statistical indicators is more meaningful. Even so, estimated means and medians are radically different, and standard errors are very high during the first weeks. These results confirm the presence of high volatility, particularly for the Italian and Spanish cases. However, as we approach recent data, processes become more stable; means and medians are similar and standard deviations become much smaller.
The weekly observations provided the following evidences:
- On week 5, we observe the first Italian data (not very reliable). At the same time, Chinese data shows a huge drop from 10.8% of the previous week to a very low 1.4% rate. It is very likely that the inflection point in the Chinese case take place on this fifth week.
- On week 6, we observe the first incomplete Spanish data (without information on DTH and REC) as well as reliable Italian data. The daily mean growth rates for Italy are very high for CON and DTH (40% and 50%, respectively) and even higher for Spain (56%)
- The last three weeks confirm the end of the pandemic for Hubei. On the other hand, while we can see decreasing trends in Italian and Spanish variables, daily growth rate is still very high, 15% for Italy and 22% for Spain, in the case of CON, and even higher values for DTH.
- Watching carefully Spanish and Italian data during the last three weeks, we can see (in spite of the short length of the series) a week lag between Spanish and Italian data. In other words, we were replicating what was happening in Italy a week earlier. Let us see if this visual leading behaviour could be used to predict Spanish outcomes using Italian variables as leading indicators.
Methodology and forecasting results
Using the information provided by the Italian data, I shall use a very simple transfer function (TF) model based on both the lags of the Spanish outputs as well as the dynamic structure of the corresponding Italian inputs. The model is estimated in levels, so it is nonstationary with limited applicability for long-run forecasts. The statistical fitting (as measured by the residual sum of squares) is also very good. I proceed as follows:
- I estimate individual models for CON, DTH and REC using data from 2/26 to 3/20 and obtain 1, 2,….5 steps ahead forecasts until March 25th.
- I repeat the same exercise including five additional observations, so my sample now ends at 3/25 and my forecast period ends at March 30th.
- I keep repeating this procedure five more times until the last string of forecasts ending on April 24th. After this date, new forecasts are difficult to evaluate due to continuous changes on the database.
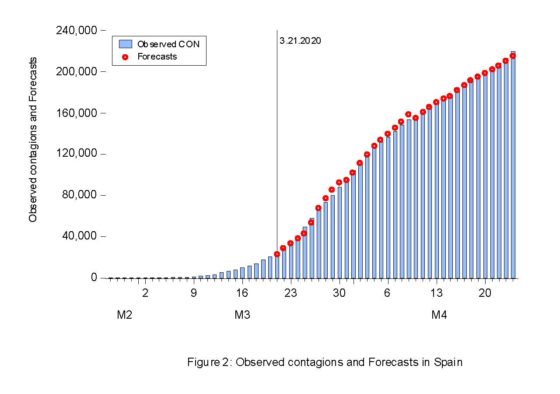
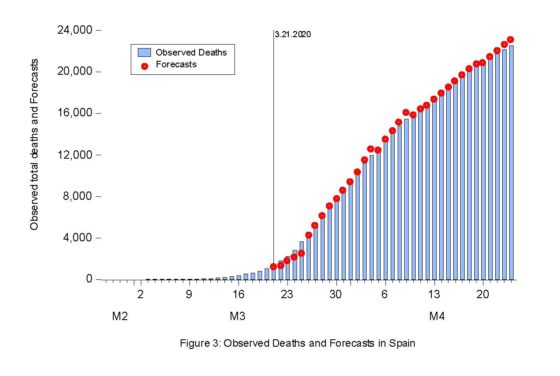
Results for CON and DTH are included in Figures 2 and 3. Forecasts are very precise for all forecasting periods and, only during the last forecasting horizon we observe a slight over-prediction in the case of DTH. Forecasts for REC (not included in this post) are also available, as well as the related prediction intervals.
Preliminary forecasting results using this methodology are very promising, in terms of both accurate daily forecasts and narrow prediction intervals. Two natural extensions of this procedure seem worth trying: i) applying the same theoretical setting to more disaggregated data at regional level, and ii) using Spanish and/or Italian data as leading indicators for other countries like France, USA or the UK that started their pandemic episodes later.